Web Tools · AGS Interpretive Report Studio

AGS Interpretive Report Studio — Turn A Factual AGS File Into A Draft Interpretive Report.

Upload an AGS4 (or AGS3.1) data file and the studio parses the groups, plots the borehole location plan, builds test-result figures and per-unit statistics, derives design parameters from published correlations, and drafts cross-referenced report text — ready for the engineer to interpret, edit and certify. Free with a KeoGeo sign-in.

v2.0.0 · runs in your browser · free with an account
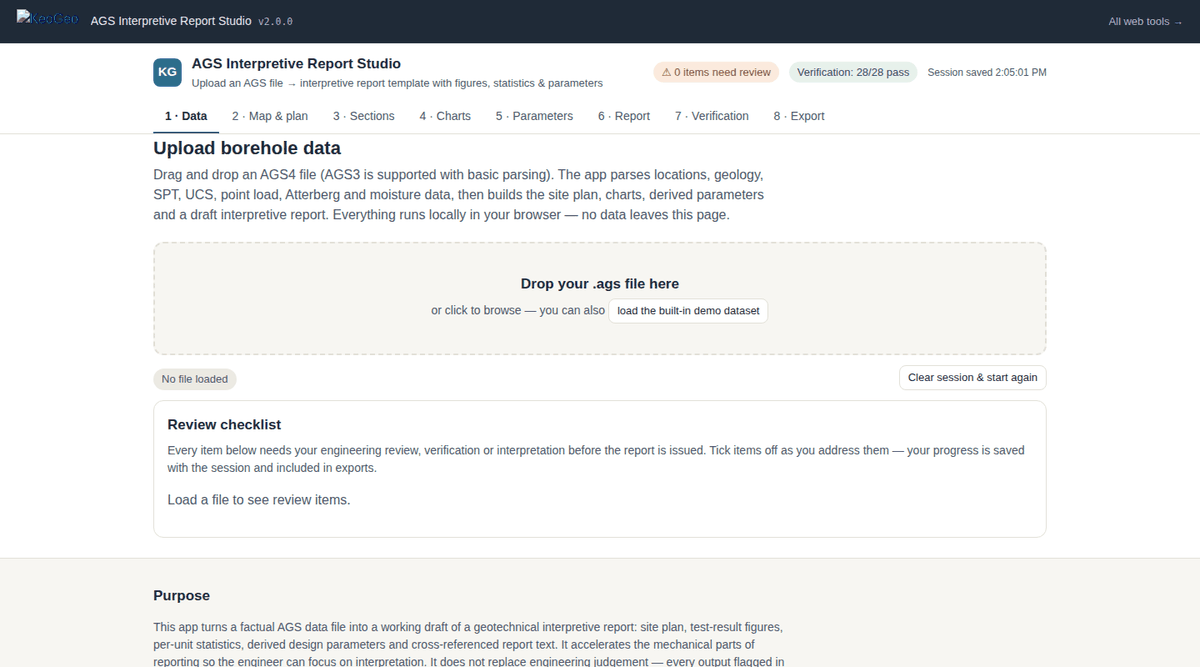
AGS Interpretive Report Studio web app — An eight-step workflow across the top — data, map and plan, sections, charts, parameters, report, verification, export — with the review checklist keeping every flagged item in view.

An eight-step workflow across the top — data, map and plan, sections, charts, parameters, report, verification, export — with the review checklist keeping every flagged item in view.

What It Does

The Mechanical Half Of Report Writing, Done Before You Open Word.

An interpretive report is half judgement and half assembly. The studio does the assembly so the geotechnical engineer can spend the time on the judgement:

  • AGS parsing — AGS 4.1 with an AGS 3.1 fallback; PROJ, LOCA/HOLE, GEOL, ISPT, RUCS, RPLT, LLPL, LNMC and SAMP groups interpreted, all other groups parsed and displayed; field mapping you can review.
  • Map and plan — interactive borehole location plan on an OpenStreetMap basemap with layer controls, borehole and stratigraphy summaries; lockable Figure 1.
  • Cross-sections — sections through selected boreholes with stratigraphy formatting options.
  • Charts — SPT N versus depth, UCS, point load, Atterberg (Casagrande A-line, AS 1726 presentation) and moisture content figures.
  • Parameter derivation — per geological unit: N60 (Skempton), cu from SPT (Stroud), φ′ from SPT (Peck, Hanson & Thornburn per Wolff), E′ from SPT (Stroud), UCS from point load (Broch & Franklin / ISRM), with editable coefficients and characteristic values (Schneider mean − 0.5σ, 25th percentile or mean).
  • Draft report — sections with cross-references to figures and tables, flagged placeholders for anything not derivable from the file (groundwater, aggressivity, in-situ stress).
  • Export and session — Word-compatible and PDF export; sessions autosave to the browser and can be saved or restored.
  • Coming in v3 — custom charts with regressions and percentiles, appended AGS/XLSX/CSV datasets, Google and WMS basemaps, alignment-based sections with drawn stratigraphy (already built; this page will update when it is published).
Example Outputs

What You Get Out Of It.

Borehole Location Plan

Figure 1 on a basemap with styled markers and labels, linked to the interactive map and lockable for the report.

Test-Result Figures

SPT, UCS, point load, plasticity and moisture figures with per-unit colouring, numbered for cross-referencing.

Parameter Tables

Per-unit statistics and derived design parameters with the correlation, coefficient and characteristic-value method recorded.

Draft Report

Cross-referenced report text exported to Word or PDF, with a review checklist of everything the engineer must confirm.

Method & References

What The Numbers Are Based On.

Every calculation in AGS Interpretive Report Studio is tied to a published source, and the in-app Sources & References section repeats this list next to the calculations themselves:

  • AGS (2021). Electronic Transfer of Geotechnical and Geoenvironmental Data, Edition 4.1 (plus AGS 3.1 fallback).
  • Skempton (1986). Standard penetration test procedures. Géotechnique 36(3) — N60 = N·Er/60.
  • Stroud (1974), Proc. ESOPT — cu = f1·N60; Stroud (1989) — E′ ≈ αE·N60.
  • Peck, Hanson & Thornburn (1974), curve fit per Wolff (1989) — φ′ = 27.1 + 0.3N60 − 0.00054N60² (N60 ≤ 60).
  • Broch & Franklin (1972); ISRM (1985) — UCS from point load, σci = K·Is50. Schneider (1997) — characteristic values. Casagrande A-line; AS 1726:2017 presentation conventions.
Limitations

Where It Stops, And What You Still Have To Check.

  • Correlations are empirical and were developed for particular soils; they may not suit your geology. Coefficients must be reviewed for every project.
  • SPT correlations use N60 only — no overburden (N1) correction; refusal values are excluded from statistics rather than interpreted.
  • Unit classification (cohesive / granular / rock / fill) is inferred from GEOL descriptions and must be confirmed.
  • The generated text is a draft template — it is not an engineering deliverable until reviewed, completed and certified by a qualified engineer. Word export uses Word-compatible MHTML; complex layouts may need tidying.

All KeoGeo tools are provided for preliminary assessment and educational purposes. Results must be verified by a suitably qualified engineer before use in design or construction; the full disclaimer is inside the app and in our terms.