Web Tools · Regression Studio

Regression Studio — Train, Validate And Explain Models On Any Table, In Your Browser.

Load a CSV or Excel file and Regression Studio fits three independent models — an MLP neural network, gradient-boosted trees and a Ridge linear baseline — on the same held-out split, then shows you the loss curves, predicted-versus-actual, residuals, permutation importance and a per-row explainer. Nothing leaves your machine. Free with a KeoGeo sign-in.

v1.1 · runs in your browser · free with an account
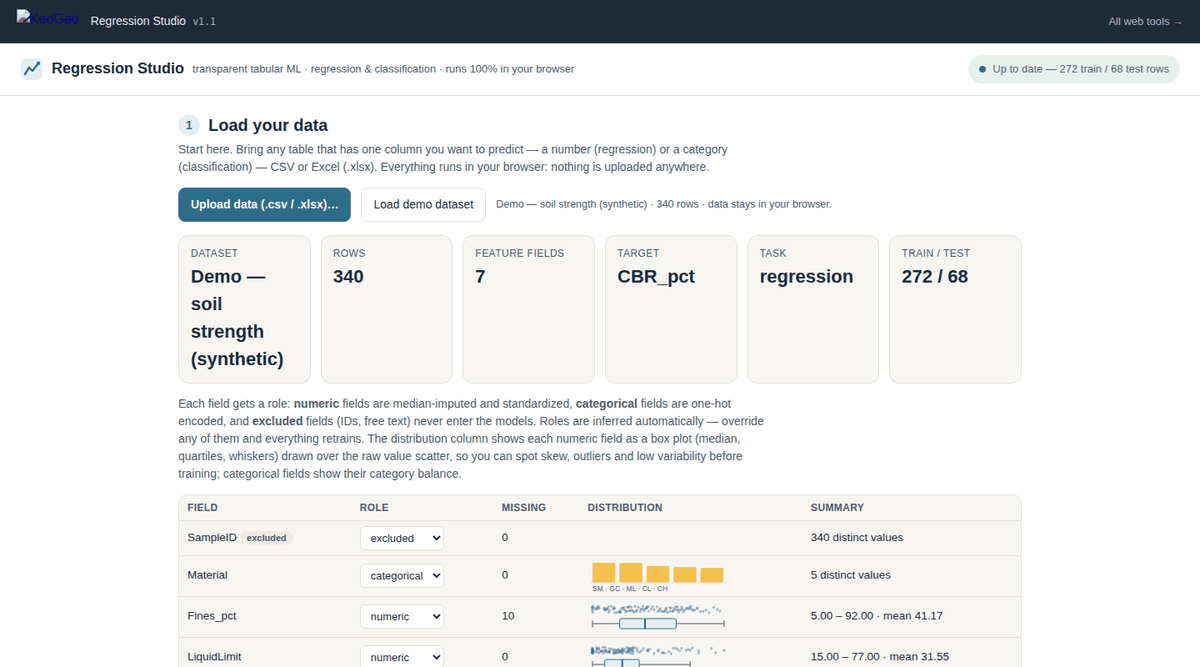
Regression Studio web app — An eleven-step top-down workflow: data load and field roles first, then model configuration, training, validation, drivers, single-prediction explainers and the report bundle.

An eleven-step top-down workflow: data load and field roles first, then model configuration, training, validation, drivers, single-prediction explainers and the report bundle.

What It Does

Three Models, One Honest Split, Every Control Explained.

Built from a CBR neural-network predictor used on real pavement data, Regression Studio generalises the workflow to any tabular problem and refuses to let you fool yourself:

  • Three models side by side — a configurable MLP (hidden layers, early stopping), gradient-boosted trees (rounds and depth) and a Ridge baseline for transparent comparison. Agreement across unrelated methods is the signal that the pattern is real.
  • Data input — CSV or .xlsx parsed client-side; automatic field-role inference (numeric / categorical / excluded) with box-plot and scatter distribution minis for every column.
  • Regression and classification — auto-detected from the target; classification surfaces a confusion matrix, per-class recall, macro-F1, log-loss and one-vs-rest Ridge coefficients.
  • No leakage — 80/20 hold-out with all preprocessing statistics fitted on training rows only; optional 5- or 10-fold cross-validation refits the whole pipeline per fold and reports mean ± sd.
  • Prediction intervals — empirical 90 % intervals from out-of-fold residuals, with the achieved test coverage reported honestly.
  • Hyperparameter sweep — 25 candidates (Ridge λ, GBT depth/rounds, MLP hidden/L2) scored on a validation slice carved from the training rows; apply any result with one click.
  • Explainability — permutation importance, standardised Ridge coefficients, a per-row contribution breakdown with the MLP forward-pass trace, and a network architecture diagram.
  • Exports and import — predictions CSV, model JSON and a one-click zip bundle (self-contained report.html, printable report.pdf, predictions.xlsx with All/Train/Test/Summary sheets, model.json); import a saved model and score it against new data as a third metric card.
Example Outputs

What You Get Out Of It.

Model Scorecards

Test R² (or accuracy / macro-F1) for each model on the same unseen rows, with cross-validation mean ± sd when enabled.

Diagnostic Plots

Training and validation loss, predicted-versus-actual, residual histogram and permutation importance.

Per-Row Explainer

Pick any row and see each field's contribution to its prediction, plus the neural network's forward-pass trace.

Report Bundle

A zip with a self-contained HTML report, printable PDF, Excel predictions and the model file — all generated in the browser.

Method & References

What The Numbers Are Based On.

Every calculation in Regression Studio is tied to a published source, and the in-app Sources & References section repeats this list next to the calculations themselves:

  • Ridge regression (Hoerl & Kennard 1970) — penalised least squares as the transparent baseline; one-vs-rest for classification.
  • Gradient-boosted decision trees (Friedman 2001) — sequential small trees, configurable rounds and depth.
  • Multilayer perceptron trained by back-propagation with early stopping and L2 regularisation; fixed seed (42) for reproducibility.
  • Permutation feature importance (Breiman 2001); k-fold cross-validation and empirical out-of-fold prediction intervals; R² and classification metrics implemented to match scikit-learn reference values.
Limitations

Where It Stops, And What You Still Have To Check.

  • The models capture correlation, not causation, and are only as representative as the rows supplied; predictions are trustworthy only inside the range of the training data.
  • Classification is limited to 2–12 classes; targets with more unique values are treated as numeric.
  • .xlsx parsing reads the first worksheet only; formula cells are taken at their cached values.
  • Training runs on the main thread — very large datasets (tens of thousands of rows) may stutter.

All KeoGeo tools are provided for preliminary assessment and educational purposes. Results must be verified by a suitably qualified engineer before use in design or construction; the full disclaimer is inside the app and in our terms.